Measuring the judgment model on this project's own runs
What this page is about: the development build loop, and nothing else. No plant sends anything anywhere because of what is described here. No screen, no API route, no agent tool and no plant data path asks a judgment model anything, and shadow mode refuses the call outright.
This is step 2 of the phasing in JEV.md: build the P1 evaluation set out of the scripted hours and measure; publish the number whatever it is. Step 1 — the questions asked beside the deterministic answers — is the build loop page. This page is what decides whether any of those probabilities may ever be compared with a line.
The two decisions underneath stay as they are: 0031 — a judgment is a proposal — and 0032 — a hosted judgment is an outbound path, classified by the state it sends. Both are still proposed. Nothing on this page chooses a threshold, and the tooling it describes cannot choose one.
Why this project can measure this at all
Most people wiring a judgment model into an MES have no way of knowing
whether its answers are any good, because nobody wrote down why each machine
stopped. This project does: the simulated plants script their own
breakdowns, changeovers, counter resets, micro-stops and idling as named
regression tests, in the line/<plant>.json the generator obeys. That file
is not documentation — it is the input — so the true reason for every stop
in a recorded run is already known.
That makes an evaluation set available here that most integrators of this model will never have.
The labelled set
fsmes jev labelled-set reads one or more lab results directories and emits
one record per window: the window, the machine, the reason it actually had,
the state the MES could see around it, and what the run's own scorecard said
about it.
Where a label comes from
The generator writes one state word per machine per simulated second, and
its precedence is fixed and readable in fsmes.sim.generate.simulate:
changeover, then breakdown, then a pre-rolled micro-stop, then scripted
blocking, then scripted starving, then the blocking and starving the line's
own buffers produce. So the state word is the truth about why a machine
stopped, and the label is read off it rather than inferred from it.
Whether a scripted event named the window is recorded separately, in
scripted. A knock-on starve is a real stop with a real reason; it is
simply one nobody wrote down in advance, and a reader needs to see how much
of a set is staged and how much is emergent.
The vocabulary
Seven options, taken from the generator's own event types and state words rather than invented. A fixed vocabulary's total is the measure of what it cannot say: a stop whose real reason is not one of these seven can only be answered wrongly.
| Option | What it means |
|---|---|
breakdown |
it was willing to run, something failed |
changeover |
a planned stop, and never downtime |
micro_stop |
a jam or a misfeed, cleared in seconds |
starved |
nothing arrived; the shortage was upstream |
blocked |
nowhere to put it; the hold-up was downstream |
counter_reset |
the counters went back to zero without a stop |
none |
it did not stop in this window; there is no reason to give |
What the question is allowed to see
The label is read off the machine's state word, so the window may not carry it. A question whose answer is printed in its own evidence measures nothing at all.
So the default view — stopped-not-why — replaces the state word with a
plain Running column, 1 while the machine was making something and 0 while
it was not, and keeps every other tag exactly as the machine published it:
the alarm word, the ready bit, the cycle time, the counters, the analogs,
and the counters and run bit of the machine immediately before and after it
on the line. That is what most machine layers publish, and it is what a real
diagnosis reads.
Some machine layers do publish a reason code. --state-view full keeps
the state word, and both views are built by the same code — so the gap
between the two measurements is the reason code and nothing else, which
makes it a number worth having rather than an argument.
What the MES could not see stays unseen
A scripted disconnect closes the OPC endpoint: the line runs on and the MES
has no state for those seconds at all
(decision 0030). The tag
history still holds them, because the generator wrote them. Handing them to
a question about what the MES observed would be inventing observation, and
writing blanks or the last state anybody heard would be two other ways of
writing down something that did not happen. So those rows are cut out and
replaced by a line saying how long the gap was, and a stop that happened
entirely inside a disconnect is marked observable: false and is not asked
about unless you pass --include-unobservable.
Negatives
A set of nothing but stops cannot show a reason being invented, and
inventing one is exactly what round 5 raised: one condition scored highest
on every run, including the six where nothing of the kind happened. So the
set also carries control windows — one per machine by default, spread
across the hour, in which the machine never stopped. Their label is none,
and an answer that finds a reason in one is visible in the matrix as a
column under a row with no stops in it.
How big a question is
Sixty seconds of line either side of the stop, at one row a second, thinned to about 120 rows for the machine and 60 for each neighbour, with the first and the last row always kept and the thinning stated in the text.
Built over two of round 5's recorded runs that came to 1,479 to 9,205 characters a window, median 5,432 — roughly 390 to 2,400 input tokens, median about 1,400. The comparison that matters: one run-level question in round 5 cost about 9,400 input tokens, because its state was the tail of a whole run. A stop window is a minute of one machine and its two neighbours, so it is the smaller question by about six times at the median.
Every size the set produced is written into the set itself, under
totals.state_characters, so a pass can be costed from the file rather than
from the bill afterwards.
The record
{
  "id": "<results>/<plant>/<equipment>/<start second>",
  "window_sim_s": [100, 160],
  "label": "breakdown",
  "label_says": "the run scripted `down` for Weld from 100s to 160s",
  "scripted": true,
  "observable": true,
  "unseen_seconds": 0,
  "state_view": "stopped-not-why",
  "state_sha256": "…", "state_characters": 5356, "state_rows": 120,
  "state": "…the window as the question is asked over it…",
  "mes_verdict": {"kind": "faults", "observed": true, "…": "…"},
  "mes_verdict_says": "the scorecard's faults[0] covers this window"
}
A window the scorecard names nothing in says so in mes_verdict_says
rather than carrying nothing: unknown is not zero.
P1, asked offline
fsmes jev ask asks one typed choice over that vocabulary, once per
window, through the same integrations/jev client the run-log triage uses —
the same MES_JEV_API_KEY, the same pinned MES_JEV_MODEL, the same
outbound register entry (llm.jev, refused in shadow mode). state_class
is observation, per decision 0032: a window of tag history is
observation-shaped, even though the plant that produced it is simulated.
A choice is the right shape because the options are not ordered — there is
no sense in which blocked is more than starved — and because a choice
proposes an option of its own, which is why a confusion matrix can be
drawn without anybody picking a threshold first.
Every answer is stored with the option chosen, the probability on it, the
whole distribution across the seven options, the stated confidence, the
model version as served, the request id and the usage, with the label
beside it. A call that fails is stored as not asked (…) and counted apart
from the answers: a judgment may not cost the thing it judges (0031), and a
matrix that counts a failure as a wrong answer is worthless.
Nothing is asked without a key. With no key — the normal case for every
installation of this package — fsmes jev ask writes a file saying it was
not asked and why, which is a record rather than a failure. Every test in
the repository runs the asked path through a transport a test wrote; none
opens a network connection.
What a pass costs, before it is spent
fsmes jev ask prints the number of calls, the characters of state and an
input-token estimate before it asks anything, and refuses above 300
calls unless you pass --yes. --dry-run prints the estimate and stops.
--limit asks about fewer.
The estimate says where its own rate came from, because an estimate a reader cannot tell from a measurement is worse than no estimate at all:
- Measured, where answers from an earlier pass of the same state view
are there to read — the
--outfile if it already exists, or any answers file named with--measure-from. Every answered record carries the characters of state it was asked over and the input tokens the service billed for it, so the rate is a division rather than a guess. The estimate is that rate per character, rounded up, so it comes in under the bill only if the next pass is dearer per character than the last one was. A call the service billed nothing for is left out of both sums rather than counted as nought tokens. - Stated, where there is nothing of that view to read: one character to a token, which is roughly how tag-history CSV tokenises. It is printed as a stated figure and says in as many words that it is not a measurement.
The first version of this estimator used 3.8 characters to a token, taken from round 5's run-log usage, and the pass below showed it wrong by about four: 454,339 input tokens printed, 1,725,959 billed. A run log is prose; a window of tag history is digits, commas and short column names. The two passes of 2026-09-17 measured 1.000 and 0.988 characters a token, so even the stated figure is about 1% optimistic on the full view, and the measured path is the one to cost a pass from.
D1's battery against the scripted hours
fsmes jev calibrate also pairs each scored run's recorded run-log battery
with what the hour was scripted to do. Two of the six questions have a truth
in the script; four do not.
| Question | What the scripted hour says |
|---|---|
component_stopped_reporting |
true where a disconnect was scripted, false where none was |
counter_went_backwards |
true where a counter_reset was scripted, false where none was |
retry_storm |
unlabelled — nothing in a scenario scripts how this MES retries |
silent_exception |
unlabelled — nothing scripts an exception in this MES |
deadlock |
unlabelled — nothing scripts a deadlock in this MES |
worst_problem |
unlabelled — a scenario scripts events, not a severity |
The unlabelled four are printed as unlabelled rather than guessed at. A guessed label measured against a probability produces a number that looks like evidence and is not.
One caveat is printed with every pairing rather than buried here: the
component_stopped_reporting question says "stopped logging before the
run ended", and a disconnect that later reconnects only half meets that
wording. The scripted windows are printed beside it so a reader can judge.
The two figures
fsmes jev calibrate --results … --set … --answers … --out <dir> writes:
calibration.md— the confusion matrix (labels × proposals, with every row, column and grand total stated), the calibration bins, the expected calibration error, and the D1 pairing table. Self-contained: every number in it can be checked against the two files it names, without running anything.p1-by-probability.svg,p1-by-confidence.svgand one SVG per labelled D1 condition — stated confidence against measured accuracy, in ten bins, with the perfect-calibration line drawn and the count printed under every bin.d1-against-truth.json— the pairing as data.
A bin with no samples is reported with a count of zero and no accuracy at all. It is never interpolated, never joined across and never left out: an empty bin is a thing the set did not measure, and a plot that hides it is a plot that claims it did.
And still no threshold
The tool chooses none, and nothing in this MES reads any number it produces. Where a bin has at least ten samples at or above it and is right at least nine times in ten throughout, the report names that bin, with its count, and says in as many words that whether it is a threshold is a person's decision and not the tool's. Where no bin manages that, it says so.
Running it
# 1. Build the set. No key, no network, no plant: this reads files.
fsmes jev labelled-set \
  --results ~/lab-results/<a run> \
  --results ~/lab-results/<another run> \
  --out build/jev/set.json

# 2. See what asking would cost, and ask nothing.
fsmes jev ask --set build/jev/set.json --out build/jev/answers.json --dry-run

# 3. Ask. Needs MES_JEV_API_KEY, MES_JEV_MODEL and the [jev] extra.
fsmes jev ask --set build/jev/set.json --out build/jev/answers.json --yes

# 4. Draw both figures, and choose nothing.
fsmes jev calibrate \
  --results ~/lab-results/<a run> \
  --results ~/lab-results/<another run> \
  --set build/jev/set.json \
  --answers build/jev/answers.json \
  --out build/jev/report
Steps 1, 2 and 4 need no key. Step 3 is the only one that asks anything, and without a key it writes a record saying it did not.
Numbers
Run on 2026-09-17, over six recorded lab runs from round 5. One pass per
state view, 305 calls each, through the pinned model: asked for
jev-1.13.0, served jev-1.13.0, and the served version stored with every
answer. The set had 311 windows; 305 were asked about and 305
were answered, 0 were not, and 6 were left out because they happened
entirely inside a disconnect.
Both reports are checked in beside this page exactly as fsmes jev
calibrate wrote them, with their figures:
Every number below is in one of those two files, and every number in them can be checked against the set and the answers they name. The sets and the answers themselves are not checked in — they are about 2 MB each — and Running it is how they are rebuilt.
The headline, both views
| State view | What the question could see | Right | Asked | Accuracy |
|---|---|---|---|---|
stopped-not-why (default) |
every tag the machine published, with the state word replaced by a running bit | 137 | 305 | 0.449 |
full |
the same window, with the machine's state word left in | 281 | 305 | 0.921 |
The gap from 0.449 to 0.921 is the leak, measured. The two sets are built by the same code over the same 305 windows, and the only difference between them is the state word — the word that names the reason. With it in the state, the answer is read off the code rather than inferred from the behaviour.
That has a consequence for who this could ever be for. A plant whose machine layer already publishes a reason code does not need a model to tell it why a machine stopped: it has the answer, and 0.921 is close to the cost of copying it across. The plant that does not publish one is the case that matters — and on this evidence the model is right on fewer than half of seven options there.
What was right, by the reason it actually had
| Scripted reason | Windows asked | Right, default view | Right, full view |
|---|---|---|---|
breakdown |
6 | 6 | 6 |
changeover |
15 | 0 | 14 |
micro_stop |
75 | 26 | 67 |
starved |
29 | 18 | 27 |
blocked |
141 | 62 | 141 |
counter_reset |
0 | 0 | 0 |
none |
39 | 25 | 26 |
| total | 305 | 137 | 281 |
counter_reset is empty because none of these six runs scripted one. An
empty row is a thing this set did not measure, and it stays in the table
saying so.
The confusion matrix, default view
Rows are the reason the generator actually scripted; columns are the reason the model proposed. A choice proposes an option of its own, so no threshold was picked to draw this.
| scripted \ proposed | breakdown | changeover | micro_stop | starved | blocked | counter_reset | none | total |
|---|---|---|---|---|---|---|---|---|
| breakdown | 6 | 0 | 0 | 0 | 0 | 0 | 0 | 6 |
| changeover | 15 | 0 | 0 | 0 | 0 | 0 | 0 | 15 |
| micro_stop | 2 | 0 | 26 | 45 | 1 | 0 | 1 | 75 |
| starved | 0 | 0 | 10 | 18 | 1 | 0 | 0 | 29 |
| blocked | 1 | 0 | 66 | 12 | 62 | 0 | 0 | 141 |
| counter_reset | 0 | 0 | 0 | 0 | 0 | 0 | 0 | 0 |
| none | 0 | 0 | 6 | 4 | 4 | 0 | 25 | 39 |
| total | 24 | 0 | 108 | 79 | 68 | 0 | 26 | 305 |
Four things in that table, in plain words:
changeoveris 0 of 15, and all 15 were calledbreakdown. A changeover is a planned stop and never downtime; a breakdown is downtime. On this set the model got the most consequential distinction in the whole vocabulary wrong every single time it was asked.blockedandmicro_stopare the two largest classes and are confused with each other and withstarved. 66 of 141 blocked windows were called micro-stops; 45 of 75 micro-stops were called starved; 12 more blocked windows were called starved. Those three states are the ones the generator distinguishes by the word the default view deliberately withheld, and they are 245 of the 305 windows asked about.noneholds up better than the stops. 25 of 39 control windows — a machine that never stopped — were answerednone. 14 were given a reason anyway, which is the round-5 failure this set was built to make visible, smaller than it was but still there.- A constant answer would have scored higher.
blockedis 141 of the 305 windows, so proposingblockedevery time, with no model and no state, would have been right 0.462 of the time against the model's 0.449. That is not a claim that the model knows nothing — it getsbreakdown6 of 6 andnone25 of 39, which a constant cannot — but on this set, over this vocabulary, its total is under the dullest possible baseline, and that is the number Step 2 asked to be published.
The full view's matrix is in
its own report; its diagonal
is 281, blocked is 141 of 141 and changeover is 14 of 15.
Calibration: stated confidence against measured accuracy
Ten bins, the count printed under every bin, empty bins left empty.
| View | Binned by | Expected calibration error |
|---|---|---|
| default | probability on the chosen option | 0.1962 |
| default | stated confidence | 0.1594 |
| full | probability on the chosen option | 0.1409 |
| full | stated confidence | 0.1819 |
| 4 measurements in total |
Expected calibration error is the average distance between what was stated and what was measured, weighted by how many samples fell in each bin. About 0.16 to 0.20 on the default view means the stated number is out by roughly a sixth to a fifth on average — and it is out in one direction: every populated bin below is under the diagonal.
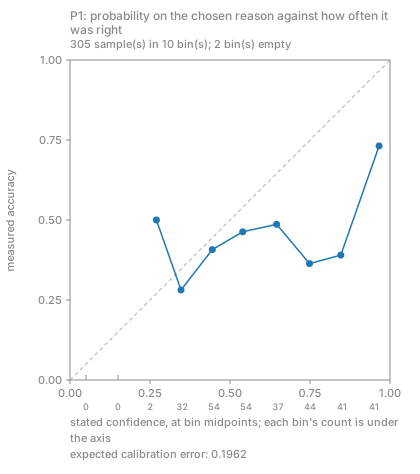
On the default view the top bin is the worst place to read this. Binned by probability, the 0.9–1.0 bin holds 41 samples and is right 0.732 of the time; binned by stated confidence, 35 samples and 0.771. The tool's own sentence, printed under both plots:
no bin has 10 or more samples at or above it and is right 90% of the time throughout. On this evidence no threshold is defensible anywhere on the scale.
The full view prints the other sentence — at or above 0.7 this set was right 90% of the time or better, over 230 sample(s). Whether that is a threshold is a person's decision, not this tool's — and that is a sentence about a question whose answer was in its own evidence. It is recorded because the tool recorded it, not because anything follows from it.
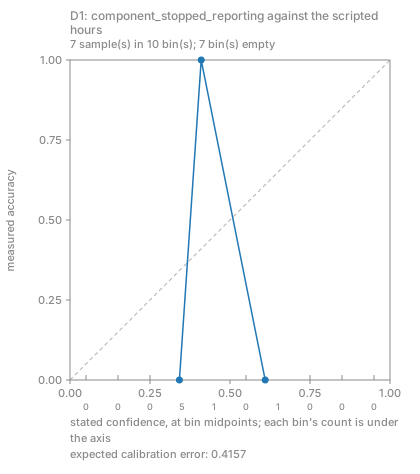
D1's battery against the scripted hours
Six questions are asked of every run log; two of them have a truth in the script. Seven run records came out of the six runs — the two-plants run writes one per plant — for 14 labelled pairs. The other 28 are printed as unlabelled rather than guessed at.
| Run record | component_stopped_reporting |
scripted | counter_went_backwards |
scripted |
|---|---|---|---|---|
| 2026-09-17-lost-connection-2 | 0.41 | true | 0.12 | false |
| 2026-09-17-one-line-bad-hour-2 | 0.34 | false | 0.11 | true |
| 2026-09-17-over-run-2 | 0.34 | false | 0.12 | false |
| 2026-09-17-scrap-burst | 0.33 | false | 0.14 | false |
| 2026-09-17-starved-and-blocked | 0.33 | false | 0.12 | false |
| 2026-09-17-two-plants-two-zones | 0.37 | false | 0.13 | true |
| 2026-09-17-two-plants-two-zones | 0.61 | false | 0.14 | true |
| 7 run records, 14 labelled pairs |
Neither question separates truth from not on this evidence, and one of them separates it backwards:
component_stopped_reportingwas 0.41 on the one run with scripted disconnects and 0.33 to 0.61 on the six with none. The highest probability of the seven, 0.61, is on a run where nothing was scripted to go silent. The caveat printed with every pairing applies here and is not an excuse for the ordering: the question says "stopped logging before the run ended", and a disconnect that later reconnects only half meets that wording.counter_went_backwardswas 0.11, 0.13 and 0.14 on the three records with a scripted counter reset and 0.12, 0.12, 0.12 and 0.14 on the four with none. The two ranges are the same range.
Fourteen pairs is a small number and these are probabilities on one run log
each, not a rate over many. They are recorded, not thresholded, and the
pairing is checked in as
d1-against-truth.json.
What it cost
| Pass | Calls | Characters of state | Input tokens billed | Output tokens |
|---|---|---|---|---|
| default view | 305 | 1,726,490 | 1,725,959 | 22,829 |
| full view | 305 | 1,655,816 | 1,676,010 | 22,720 |
| both, total | 610 | 3,382,306 | 3,401,969 | 45,549 |
Every one of the 610 calls came back with its usage; none reported none. About 5,600 input tokens a call, against a dry run that had printed about 1,490 — the estimator was wrong by a factor of about four, and it has been fixed to measure its rate from a stored pass of the same view instead.
What this decides for the product half
Step 2 is the step the survey says decides the product half. On this evidence:
- Nothing here justifies a threshold, a gate, or an automatic label. The tool says no threshold is defensible anywhere on the default view's scale, and the full view's threshold sentence is about a question that could read its answer off its own evidence. Decision 0031 — a judgment is a proposal — is not merely still defensible; it is the only reading this set supports.
- The most that could be justified is P1 as a displayed proposal, with its probability shown, and only after the calibration improves or the question is reshaped. A proposal that is right 0.449 of the time, shown to an operator beside the tags it was drawn from, costs a glance. The same number written into a downtime record costs the record.
- The question may be the thing to change, not the model. Three of the
seven options —
blocked,starved,micro_stop— carry 245 of the 305 windows and are exactly where the answers go wrong. A question that asked "did something break, was it planned, or was the line simply waiting" over three options is a different measurement, and this set can be re-asked that way for the price of one more pass. That is a thing to try, not a thing that has been shown to work. - The class ladder in decision 0032 is untouched by this. 0032 classifies a question by the state it sends, and these numbers are about whether an answer is any good, not about what left the building. Both decisions stay proposed, and neither is edited here.
Nothing is scheduled off this page. What happens next is the maintainer's call, made with these numbers in front of him.
What is not here
- No real plant. Every number above comes from simulated lines whose reasons are the generator's own input. That is the whole reason an accuracy could be computed at all, and it is also the limit of what the number means.
- Six runs, one model version, one day.
jev-1.13.0on 2026-09-17. TypeSafe has saidconfidencewill drift across versions, so a version change is a re-validation and this page is dated for that reason. - No second opinion. Each window was asked once. Nothing here measures whether the same window asked twice gets the same answer.
counter_resetwas never asked about. The vocabulary carries it; this set has none of it.